(PPS per inhabitant)
Source: Eurostat (ilc_di03)
Social transfers contributed 5 416 PPS per inhabitant to median disposable income
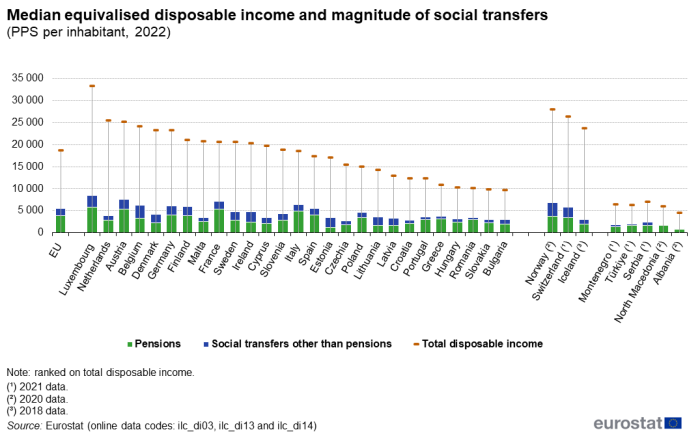
Figure 1 shows the contribution of social transfers to disposable income. This information is split between transfers for pensions and other social transfers, for example, social security benefits and social assistance that aim to alleviate or reduce the risk of poverty.
 Figure 1: Median equivalised disposable income and magnitude of social transfers, 2022
(PPS per inhabitant)
Source: Eurostat (ilc_di03), (ilc_di13) and (ilc_di14)
In 2022, the total median annual disposable income per inhabitant in the EU was 18 706 PPS. For the EU as a whole, social transfers (including pensions) resulted in an increase of 5 416 PPS per inhabitant of the median disposable income, with social transfers other than pensions contributing to 1 537 PPS.
Among the EU Member States, there were considerable variations in the contribution made by social transfers to median disposable income in 2022. The largest transfers were observed in Luxembourg, where social transfers (including pensions) increased the median disposable income by 8 395 PPS per inhabitant. Social transfers (including pensions) were also relatively high in Austria (7 501 PPS) and France (7 069 PPS).
A somewhat different pattern emerges if pensions are excluded from the analysis. In 2022, social transfers other than pensions contributed more than 2 500 PPS per inhabitant to median disposable income in Belgium (2 969 PPS) and Luxembourg (2 656 PPS).
It is interesting to compare the level of social transfers across the EU Member States including and excluding pensions. In Estonia, social transfers including pensions in 2022 were only around 1.5 times higher than social transfers excluding pensions. By contrast, in Romania, the value of social transfers including pensions was 7.4 times higher than social transfers excluding pensions. Finally, in Greece, Portugal and Croatia social transfers including pensions were respectively 6.7, 5.6 and 4.5 times higher than transfers excluding pensions.
Income inequality
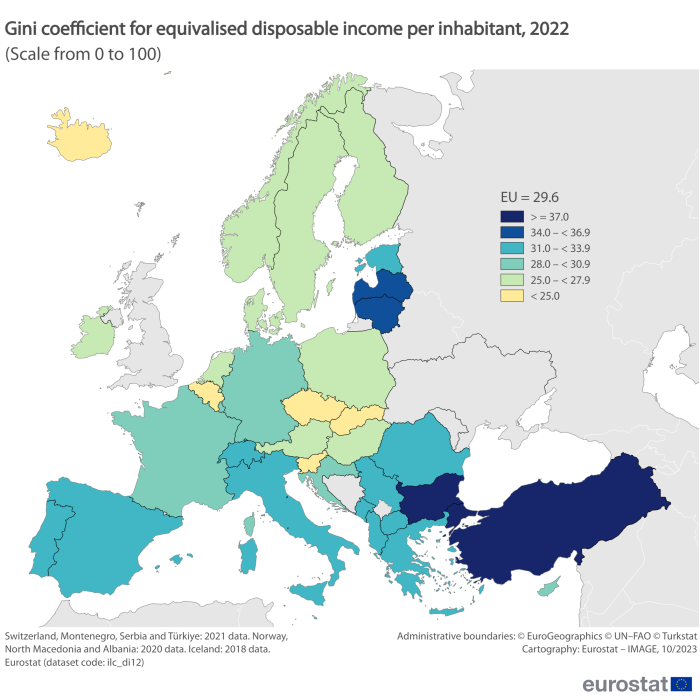
Median disposable income provides a measure of average living standards, but it does not capture the distribution of income within the population. The Gini coefficient gives the extent to which the distribution of income within a country deviates from a perfectly equal distribution. A Gini value of 100 means that only one person receives all the income in the country, while a Gini value of 0 means that income is distributed equally across the population.
Income inequality as measured by Gini coefficient above the EU average in 11 Member States
In 2022, the Gini coefficient for the EU was 29.6. The highest income disparities among the EU Member States (with a Gini coefficient of at least 34.0 as shown by the darkest shade in Map 2) were recorded in Bulgaria (38.4), Lithuania (36.2) and Latvia (34.3). A group of Member States, with a Gini coefficient above the EU average of 29.6 and ranging between 31.0 to 33.9, comprised Malta, Greece, Estonia, Spain, Portugal, Romania and Italy. In Croatia, Germany, Cyprus, Luxembourg and France, the Gini coefficients were close to the EU average, indicating income distributions consistent with the EU coefficient. At the other end of the scale, income was more evenly distributed in Slovakia, Slovenia, Czechia and Belgium, where the Gini coefficient was less than 25.0.
 Map 2: Gini coefficient for equivalised disposable income per inhabitant, 2022
(%)
Source: Eurostat (ilc_di12)
Income in real terms
EU median disposable income in real terms increased by 20 % since 2010
The income in real terms shows the annual evolution of households’ purchasing power following the financial crisis of 2008. Conversion to ‘real terms’ is computed using, as a price deflator, the Harmonised Index of Consumer Prices (HICP) of the income year reflected in the median equivalised disposable income (i.e. the HICP of the ‘survey year – 1’). The indicator is expressed as an index (with index at 100 for base year = SILC 2010).
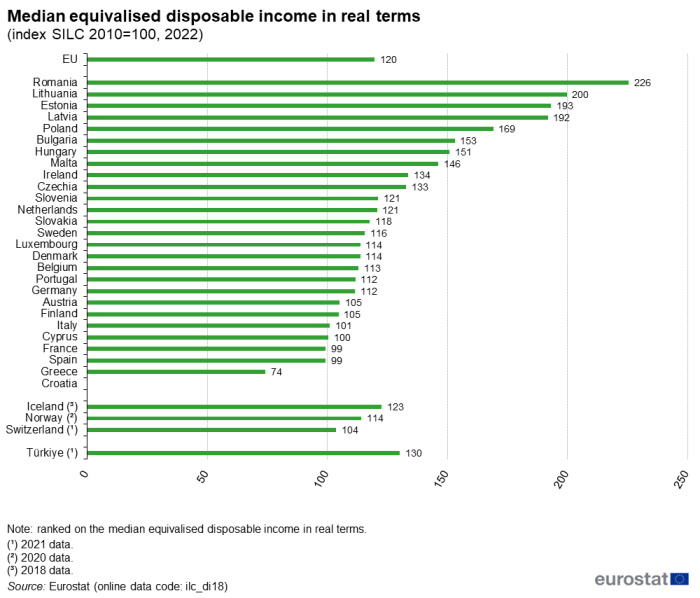
In 2022, the disposable income in real terms in the EU was at an index of 120. This indicates that, on average, there has been a real increase of 20 % of the disposable income since 2010 (see Figure 2).
In the EU, most Member States reported a rise of the median disposable income in real terms. Romania led the real disposable income ranking with an index of 226, reflecting an increase of more than double since 2010. Lithuania was next with 200, followed by Estonia at 193 and Latvia at 192. By contrast, Greece had the lowest index at 74, indicating a decrease from 2010. Spain and France were just below the 2010 benchmark at 99, while Cyprus matched it at 100, and Italy slightly surpassed it with 101.
 Figure 2: Median equivalised disposable income in real terms, 2022 (Index SILC 2010 = 100)
(%)
Source: Eurostat (ilc_di18)
The data used in this article are derived from EU statistics on income and living conditions (EU-SILC). EU-SILC data are compiled annually and are the main source of statistics that measure income and living conditions in Europe. It is also the main source of information used to link different aspects relating to the living conditions of households and individuals.
The reference population for the information presented in this article is all private households and their current members residing in the territory of an EU Member State (or non-EU member country) at the time of data collection. Persons living in collective households and in institutions are generally excluded from the target population. The data for the EU are population-weighted averages of national data.
The reference time for information on income is 2021, while the other households’ characteristics are referenced to 2022.
Context
To take into account differences in household size and composition and thus enable comparisons of income levels, the concept of equivalised disposable income is used. It is based on the total net (also referred to as disposable) household income divided by the number of ‘equivalent adults’, using a standard (equivalence) scale. Eurostat uses a ‘modified OECD scale’ which gives a weight to each member of a household according to their age and then adds the weights up to arrive at an equivalised household size (taking into account the number of persons in the household – more details are provided in the glossary). Household disposable income, derived as the sum of the income received by every member of the household and by the household as a whole, is divided by the equivalised household size to determine the equivalised disposable income attributed to each household member.
The median of the equivalised disposable income distribution is typically used in the EU as a key measure for analysing standards of living within each economy. It is simply the income level that divides the population into two groups of equal size: one group encompasses half the population with a level of disposable income above the median and the other group encompasses the half of the population with a level of disposable income below the median. The use of the median (rather than the arithmetic mean) avoids any potential distortion that may be caused by the existence of extreme values, such as a few extremely rich households that may raise the arithmetic mean.
Income in real terms reflects the level of the median equivalised disposable income, taking changes in prices into account. It is presented as an index, based on the median equivalised disposable income retrieved from SILC, and the Harmonised Index of Consumer Prices (HICP) data, which is used as a price deflator. The national median equivalised disposable income (in current prices) for a given Member State, used in this indicator, is derived from SILC data, with the income reference period set as the ‘survey year – 1’. Conversion to ‘real terms’ is done using the Harmonised Index of Consumer Prices (HICP) of the income year reflected in the median equivalised disposable income (i.e. the HICP of the ‘survey year – 1′). The indicator is then computed as an index, with the base year set at SILC 2010. The selection of the base year (SILC 2010) was made by the Social Protection Committee – Indicators Sub-Group (SPC-ISC) to capture the annual evolution of households’ purchasing power in the aftermath of the 2008 economic and financial crisis.
Source link : https://ec.europa.eu/eurostat/statistics-explained/index.php/Living_conditions_in_Europe_-_income_distribution_and_income_inequality
Author :
Publish date : 2024-09-26 07:00:00
Copyright for syndicated content belongs to the linked Source.


