
Map 1: Cultural employment 2023
(% of total employment)
Source: Eurostat (cult_emp_sex)
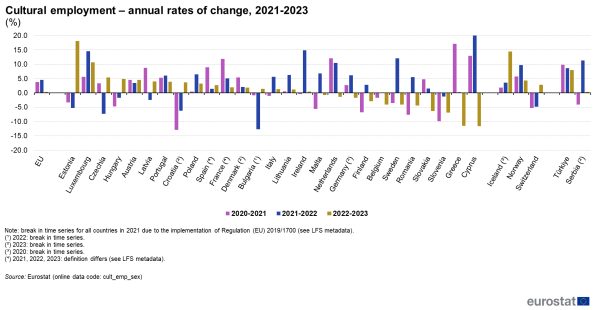
In 2023 cultural employment increased in 16 EU countries and decreased in 11
In 2023, cultural employment increased in 16 EU countries compared to 2022. Estonia (18.0%) and Luxembourg (10.7%) recorded the highest increases, while Greece (–11.5%) and Cyprus (–11.6%) saw the most significant decreases (see Figure 1).
At EU level, in 2023, cultural employment showed a modest annual increase of 0.4%. However, the evolution of cultural employment has varied considerably across Europe in recent years. In 8 countries, a growth in cultural employment was recorded consecutively in 2021, 2022, and 2023. In 4 of those countries, a growth in 2023 was observed for the first time since the onset of the COVID-19 crisis. Conversely, in the other 4 countries, after two consecutive years of increase, cultural employment declined in 2023. Belgium and Slovenia have seen a continuous decline in cultural employment since 2020.
(%)
Source: Eurostat (cult_emp_sex)

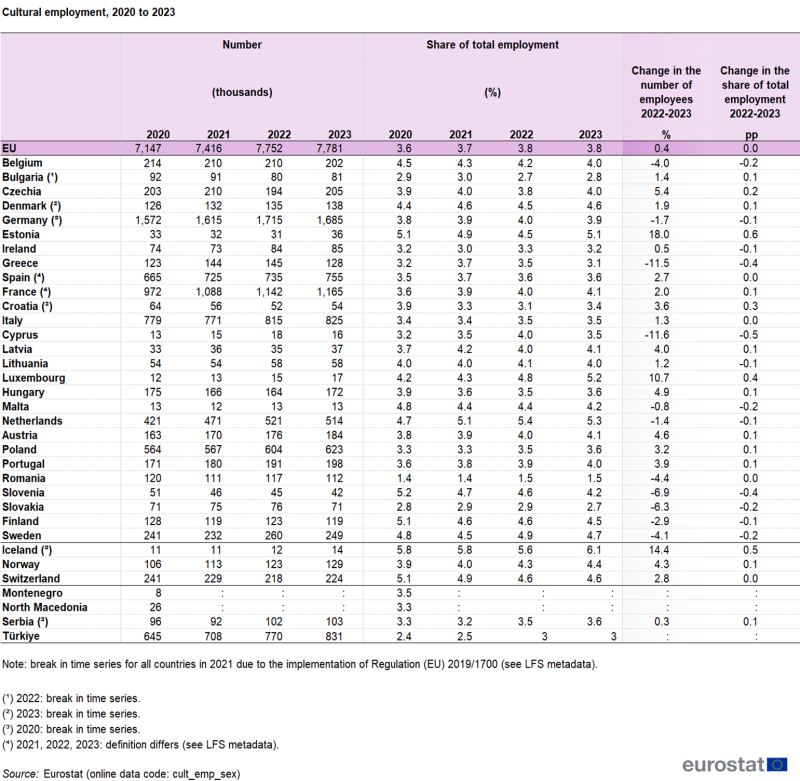
Table 1 presents data on cultural employment for 2020, 2021, 2022 and 2023, providing information on the absolute number of people in cultural employment and the share of total employment at EU and national levels. Significant increases between 2022 and 2023 were observed in France (+ 23 000), Spain (+ 20 000), and Poland (+ 19 000). It should be noted that during the COVID-19 period, the standard definition of employment and absence from work could not be strictly applied in Spain and France, where individuals temporarily laid-off due to pandemic restrictions were counted as in employment. In the same period, Germany, Greece and Sweden experienced the greatest decline in cultural employment, with a decrease of 29 000, 17 000 and 11 000 individuals, respectively. Regarding cultural employment as a share of total employment, increases were observed in 12 EU countries. The highest rise of 0.6 percentage points (pp) was recorded in Estonia. By contrast, 12 EU countries saw a decrease in this share, the most in Cyprus (–0.5 pp), Greece and Slovenia (–0.4 pp each).
Source: Eurostat (cult_emp_sex)

Trends in employment across cultural sectors
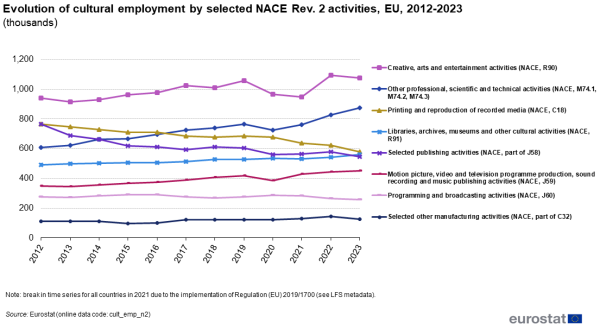
In the following paragraph we present the distribution of people employed across cultural sectors as defined by the NACE Rev.2 classification of economic activities. Figure 2 shows employment trends at EU level in selected cultural sectors since 2012, encompassing most individuals included in cultural employment statistics (57.5%).
Recent observations indicate the following trends in employment development within the cultural sectors:
a year-on-year increase in the number of employed persons in 2021 and 2022 is observed in activities related to design, photography and translation (NACE M74.1, M74.2, M74.3), as well as in the audio-visual production sector (NACE J59); the values recorded in 2023 align with the long-term trend specific to these sectors;
employment in the sector related to cultural heritage (NACE R91) shows a long-term growth trend, which continued in 2023;
employment in the sector related to cultural manufacturing (part of NACE R32) has remained stable for years, with a noticeable increase in 2022 and returning to previous levels in 2023;
the creative, arts, and entertainment activities sector (NACE R90) faced a substantial decline in employment in 2020, and, after a sharp increase to 1.09 million employed persons in 2022, it amounted to 1.08 million in 2023, which was a higher number than in the years preceding the COVID-19 crisis;
the publishing sector (part of NACE J58 – Publishing activities), which showed a slight increase in employment in 2021 and 2022, returned to its long-term downward trend in 2023;
Employment in occupations related to content reproduction and mass distribution (NACE C18 — Printing and reproduction of recorded media and NACE J60 — Programming and broadcasting activities) continued along a downward trend.
(thousands)
Source: Eurostat (cult_emp_n2)

Characteristics of cultural employment in 2023
Cultural employment by sex, age and educational attainment
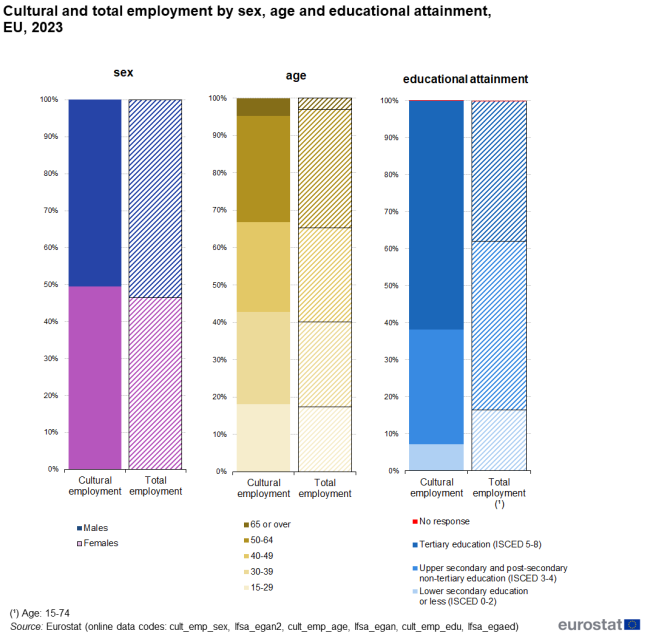
In 2023, the socio-demographic profile of cultural employment in the EU did was slightly different from that of total employment, in particular concerning sex and age. However, the differences where more significant when these groups were broken down by educational attainment level.
In the cultural sectors, women had a higher share compared to the whole economy (with a share of 49.5% versus 46.4%). When broken down by age, cultural employment showed higher percentages of people aged 30-39 (24.7% in cultural employment versus 22.7% in total employment), those aged 65 and over (4.8% versus 3.0% in total employment), and those aged 15-29 (18.1% versus 17.4%). Conversely, there were fewer people in cultural employment compared to total employment in the age groups 50-64 (28.5% versus 31.8%) and 40-49 (24.0% versus 25.2%).
The educational attainment structure of cultural and total employment has shown a significantly greater difference. According to the 2023 data, the socio-demographic profile of cultural employment was characterized by a generally higher level of educational attainment, with 61.8% of cultural workers having tertiary education (ISCED 5-8), 30.9% having upper secondary education and 7.2% of them having the lowest levels of educational attainment (ISCED 0-2). In total employment, these figures accounted for 37.8%, 45.7% and 16.4%, respectively (see Figure 3).

The share of women in cultural employment
Between 2013 and 2023, the number of women employed in culture-related activities steadily increased across the European Union, except in 2020. In 2023, the number of women employed in culture increased by 1% compared to the previous year, while cultural employment for men decreased by around 0.2%. As a result of these changes, the difference in cultural employment share between men and women narrowed to just 1 pp (50.5% men and 49.5% women) in 2023 (see Figure 4).
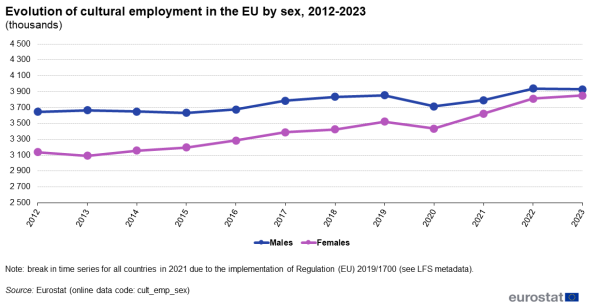
(thousands)
Source: Eurostat (cult_emp_sex)

While the share of men and women in cultural employment at the EU level in 2023 was almost equal, the picture varied somewhat across Member States. In 16 EU countries, there were more women than men in cultural employment, with the highest national share observed in Latvia at 63.0%, followed by Luxembourg at 61.4% and Lithuania at 58.3%. Countries with the lowest percentage of women in cultural employment were Spain, Italy (45.1% each) and Slovenia (45.5%).
For more detailed information on the characteristics of cultural and total employment figures broken down by sex, age and educational attainment, please refer to the ![]()

Some other characteristics of cultural employment
The EU-LFS also provides information on additional socioeconomic characteristics that may be used to analyse cultural employment in more detail, including self-employment and working pattern (full-time and part-time employment).
Self-employment
Besides the high share of tertiary educated workers, cultural employment is also characterised by a relatively high proportion of self-employed persons. This reflects the independent and specialised nature of many occupations in the cultural sector — for example, authors, performing artists, musicians, painters and sculptors or craftspeople.
In 2022, almost one-third (31.7%) of cultural workers across the EU were self-employed (compared to an average of 13.8% in the whole economy). Self-employment accounted for nearly half of all cultural employment in Italy (46.6%) and the Netherlands (45.7%). The other countries with rates of cultural self-employment higher than the EU average were Czechia, Greece, Slovenia, Ireland, Belgium, Spain, Austria and Slovakia. By contrast, less than 20% of those in cultural employment were self-employed in Bulgaria, Luxembourg and Romania.
The level of self-employment in the field of culture was higher than the level of self-employment in the national economy, in all 27 EU countries.
Full-time work
In 2023, more than three quarters (75.8%) of cultural workers in the EU were employed on a full-time basis, (5.4 p.p. less than in the whole economy). This pattern occurred in almost all EU countries, except for Belgium, the Netherlands and Romania. The smaller proportion of people working full-time in culture-related professions could be explained, at least partly, by a number of cultural jobs being characterised by self-employment/freelancing and job flexibility. However, this situation can result in job insecurity and considerable variations in income over time. Full-time employment in the cultural field varies significantly across countries, ranging from 58.9% in the Netherlands to 95.6% in Bulgaria and 97.6% in Romania. These differences primarily reflect variations in national labour markets, such as the prevalence of part-time work, rather than unique features specific to cultural employment.
Permanent jobs and employment with one-job positions
Less pronounced differences between total and cultural employment concerned job permanency and single-job holding. In 2023, permanency of job was 4.7 pp lower for cultural employment (81.8%) than for total employment (86.5%). The lowest rates of permanent employment in cultural sectors were observed in the Netherlands (68.5%) and France (72.0%), while the highest rates were seen in Romania (99.5%), Lithuania (98.6%), and Bulgaria (98.2%).
Holding one job was slightly less common in cultural employment than in total employment in almost all EU countries. The only exception concerned Romania, where the rate for cultural employment was 99.8%, compared to 99.4% for total employment (see Table 2).
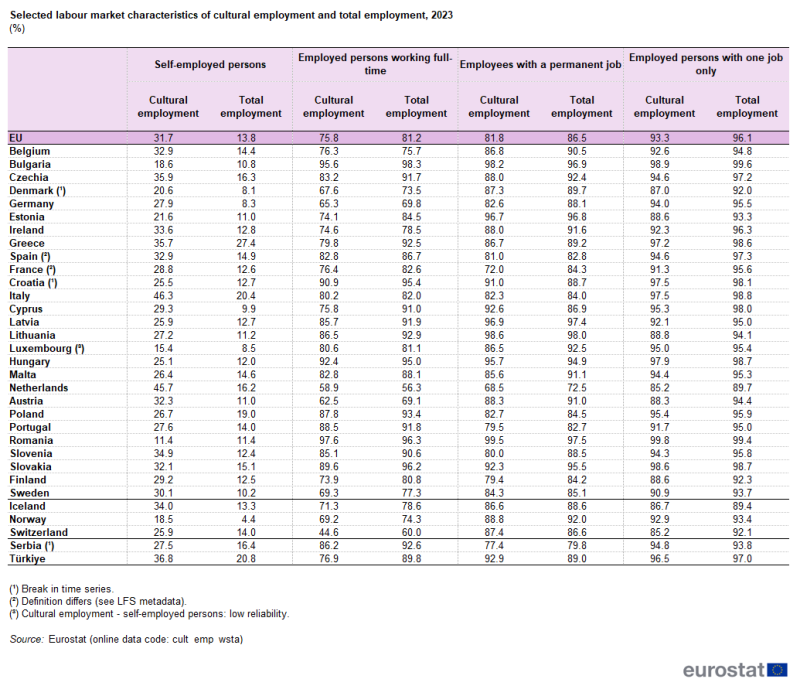
(%)
Source: Eurostat (cult_emp_wsta)

Focus on artists, authors, journalists and linguists
This final section of the article presents information on the employment characteristics of two groups of cultural occupations (as defined in the ISCO-08 classification under groups 264 and 265): creative and performing artists (including visual artists, musicians, dancers, actors, film directors, etc.) and authors, journalists and linguists. These two types of occupations here are referred to as ’artists and writers’.
In 2023, the European Union had more than 1.7 million artists and writers, constituting 22% of all cultural employment. Among them, around 45.2% were self-employed, a significantly higher proportion compared to both total employment (13.8%) and the cultural employment of the EU (31.7%). In Germany, the share of self-employed artists and writers was 5.2 times higher than the share of self-employed persons in the total national economy. The self-employment rate among artists and writers also significantly exceeded the total national level in Cyprus (low reliability), Austria, Sweden, Ireland, Lithuania, and the Netherlands. Additionally, rates of at least 50% self-employment among artists and writers were observed in Italy (64.9%), Ireland (55.9%), Czechia (54.8%), Austria (51.6%), Portugal (50.6%), and Slovakia (low reliability).
In 2023, the full-time employment rate among artists and writers in the EU was 71.7%, slightly lower than the rates observed for cultural employment (75.8%) and the overall economy (81.2%). The most visible contrast was seen in Estonia, where the proportion of full-time artists and writers was around 22 pp lower compared to the level of total employment (62.2% vs 84.5%). In turn, Luxembourg, the Netherlands and Denmark were the only EU countries where the percentage of full-time artists and writers exceeded the proportion of full-time workers in the entire national economies (by 4, 2 and 1 pp respectively). Notably, the Netherlands had the lowest full-time employment rates in 2023 across the EU, with 58.4% for artists and writers and 56.3% for total employment.
A sign of the precarious nature of employment faced by artists and writers can be seen in the duration of their work contracts. In 2023, 86.5% of all employees in the EU had a permanent employment contract, while among artists and writers, a permanent contract was held by less than three-quarters (71.4%) of employees. Compared with the total national employment, a lower percentage of artists and writers had a permanent contract in most EU countries, apart from Cyprus, Croatia, Romania (all three countries with low data reliability), and Lithuania.
The greatest difference between values recorded for the total economy and these creative activities was in France (34.9 pp), where, in 2023, only around half of the people employed as artists and writers had a permanent contract (49.4%).
Beside their main job, some artists and writers have a second job. Across the EU, most people (96.1%) in overall employment held a single job in 2023. Artists and writers were less likely (91.1%) to have just one job, and this pattern occurred in all EU countries except Croatia and Romania. The share of artists and writers with just one job was more than 10 pp below the level of the total economy in Lithuania and Austria. In addition, Lithuania was the country with the lowest share of single-job employment for artists or writers among EU countries in 2023 (78.3%), with about one in five artists or writers holding more than one job (see Table 3).
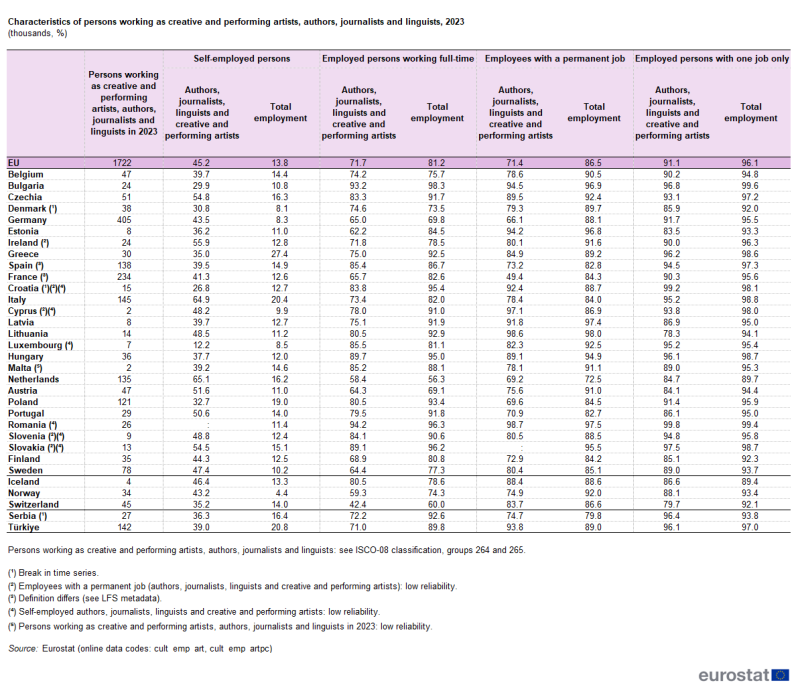
(thousands, %)
Source: Eurostat (cult_emp_art) and (cult_emp_artpc)

Source data for tables and graphs
Data sources
The statistical concept of cultural employment is based on the methodology proposed by the European Statistical System Network on Culture (see the ESSnet-Culture final report (2012)).
The ESSnet-Culture report defines cultural employment by crossing economic activities (based on the statistical classification of economic activities in the European Community – NACE Rev. 2) with a set of occupations (using the international standard classification of occupations – ISCO-08).
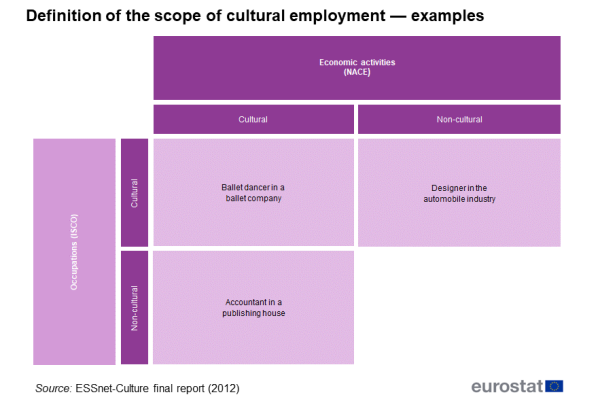
Defining cultural employment
As the ESSnet-Culture report notes, cultural employment covers three types of situations (see Figure 5):
an employed person holds a cultural occupation and works in the cultural sector (for example, a ballet dancer employed by a ballet company or a journalist working for a daily newspaper);
an employed person holds a cultural occupation outside the cultural sector (for example, a designer who works in the motor vehicles industry);
an employed person holds a non-cultural occupation in the cultural sector (for example, an accountant working in a publishing house).

Eurostat’s statistics on cultural employment are sourced from the EU-LFS; the population covered by this data collection concerns people aged 15 and more. Eurostat compiles data on cultural employment according to the field of economic activity in which the employed person works and their occupation, using a matrix to create an aggregate for all cultural employment. The data may be analysed at a more detailed level, for example, broken down by sex, age or by the level of educational attainment.
The two lists below contain the economic activities (NACE Rev. 2) and occupations (ISCO-08) used to calculate aggregates for cultural employment from the EU-LFS.
Cultural sectors (economic activities) — NACE Rev. 2
18
Printing and reproduction of recorded media
32.2
Manufacture of musical instruments
58.1
Publishing of books, periodicals and other publishing activities
59
Motion picture, video and television programme production, sound recording and music publishing activities
60
Programming and broadcasting activities
74.1
Specialised design activities
74.2
Photographic activities
74.3
Translation and interpretation activities
90
Creative, arts and entertainment activities
91
Libraries, archives, museums and other cultural activities
Cultural occupations — ISCO-08
216
Architects, planners, surveyors and designers
2353
Other language teachers
2354
Other music teachers
2355
Other arts teachers
262
Librarians, archivists and curators
264
Authors, journalists and linguists
265
Creative and performing artists
3431
Photographers
3432
Interior designers and decorators
3433
Gallery, museum and library technicians
3435
Other artistic and cultural associate professionals
3521
Broadcasting and audio-visual technicians
4411
Library clerks
7312
Musical instrument makers and tuners
7313
Jewellery and precious-metal workers
7314
Potters and related workers
7315
Glass makers, cutters, grinders and finishers
7316
Sign writers, decorative painters, engravers and etchers
7317
Handicraft workers in wood, basketry and related materials
7318
Handicraft workers in textile, leather and related materials
7319
Handicraft workers not elsewhere classified
The EU-LFS requires data to be provided for NACE divisions (two-digit level) and for ISCO minor groups (three-digit level). However, most countries provide a more detailed classification on a voluntary basis. For countries missing information at NACE three-digit level or/and ISCO four-digit level, the estimate is made using coefficients calculated for countries that provide the highest level of detail.
Estimating cultural employment
When estimating cultural employment, it is difficult to determine the proportion of some economic activities and occupations that is genuinely cultural. For this reason, activities and occupations which are only partially cultural were excluded from the estimates. For example, sports, recreation and cultural centre managers (ISCO Unit Group 1431) refers to an occupation with a cultural component; however, it is impossible to estimate the share specifically relating to culture. Therefore, and taking a conservative approach, it was decided to exclude this occupation (and other similar cases) when computing an aggregate for cultural employment.
Moreover, the EU-LFS collects (detailed enough) information on the economic activity and occupation only of the respondent’s main job and therefore omits information about secondary jobs (e.g., in the field of culture). Consequently, these secondary jobs are excluded from the aggregate covering cultural employment.
In view of these limitations and the approach adopted, data on cultural employment are likely to underestimate the true extent of employment in this field.
Time series
Regulation (EU) 2019/1700 came into force on 1 January 2021 and resulted in a break in the EU-LFS time series for several EU Member States. To monitor the evolution of employment and unemployment despite the break in the time series, Member States assessed the impact of the break in their country and computed impact factors or break corrected data for a set of indicators. Break corrected data are published for the LFS main indicators.
More information on the EU-LFS can be found via the online publication, which includes eight articles on the technical and methodological aspects of the survey. The EU-LFS methodology in force from the 2021 data collection onwards is described in methodology from 2021 onwards. Detailed information on coding lists, explanatory notes and classifications used over time can be found under documentation.
Context
Culture is one of Europe greatest assets: it is a source of values and identity and creates a sense of belonging. It also contributes to well-being, social cohesion and inclusion. The cultural and creative sectors can trigger economic growth, job creation and international trade.
This is why culture is becoming more important in the EU. In line with Article 167 of the Treaty of Lisbon, the EU ‘shall contribute to the flowering of the cultures of the Member States, while respecting their national and regional diversity and at the same time bringing the common heritage to the fore’.
The EU supports these objectives through the Creative Europe programme and several policy actions included in the work plan for Culture (2023-2026) setting the main priorities for European cooperation in cultural policymaking: empowering the cultural and creative sectors; enhancing cultural participation and the role of culture in society; unleashing the power of culture; and strengthening the cultural dimension of the EU external relations. According to the work plan, implementation should also be supported by optimised use of quality data and statistics.
Source link : https://ec.europa.eu/eurostat/statistics-explained/index.php/Culture_statistics_-_cultural_employment
Author :
Publish date : 2024-07-30 07:00:00
Copyright for syndicated content belongs to the linked Source.