Source: Eurostat (ds-045409)
In 2023, the EU share of agricultural products in total trade was 8.1 %, up 0.4 percentage points (pp) compared with 2013 (see Figure 2). Since 2013, the share for exports has been higher than for imports. This difference was greater in 2022, when it reached 2.4 pp.
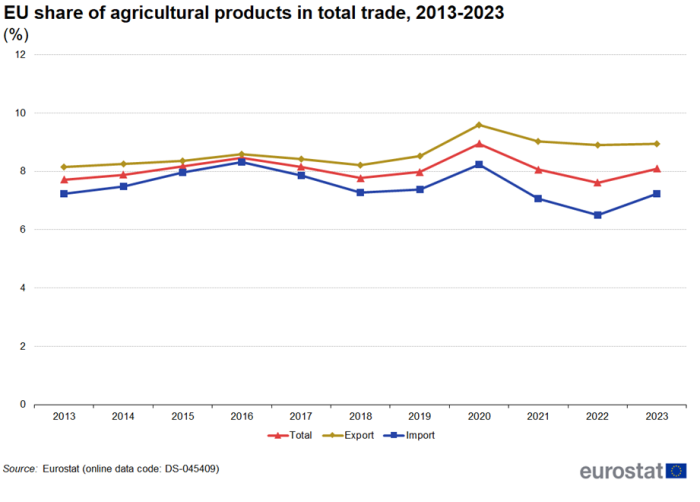 Figure 2: EU share of agricultural products in total trade, 2013-2023
Source: Eurostat (ds-045409)
The EU imported 154 million tonnes of agricultural products in 2023, while it exported 134 million tonnes (see Figure 3). Between 2013 and 2023, the total trade volume had an average annual growth rate of 1.9 %. Imports (2.5 %) increased more than imports (1.2 %).
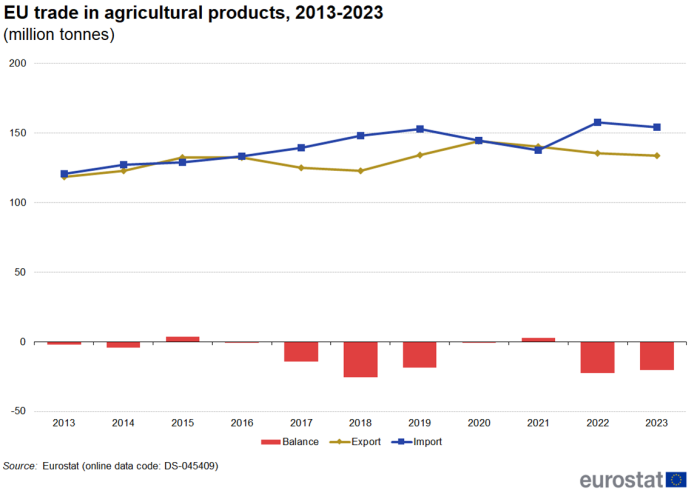 Figure 3: EU trade in agricultural products, 2013-2023 (1000 tonnes)
Source: Eurostat (ds-045409)
Agricultural products: four groups
Agricultural products can be subdivided into four groups: animal products, vegetable products, fats and oils and foodstuffs (see Figure 4). In 2023, measured in value, the largest group in exports was foodstuffs (54 %) followed by animal products, vegetable products (both 22 %) and fats and oils (4 %). In imports, the largest group was also foodstuffs (37 %) followed by vegetable products (36 %), animal products (20 %) and fats and oils (7 %).
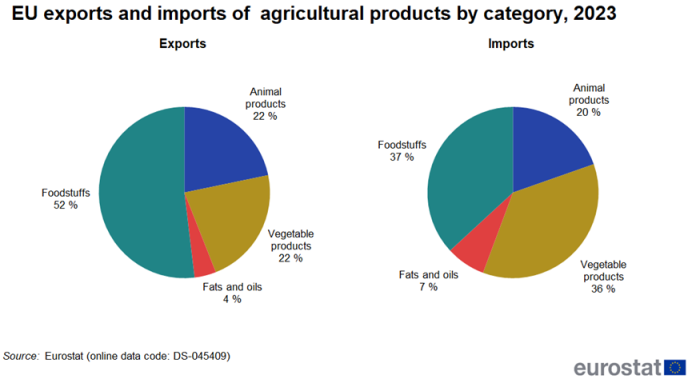 Figure 4: EU trade of agricultural products by category, 2023
Source: Eurostat (ds-045409)
Each of the categories discussed above can be subdivided into chapters (see Figure 5).
The animal products category consists of five chapters. In exports of animal products, the largest chapters were ‘meat and edible meat offal’ (36 %, €16 billion) and ‘dairy produce; birds’ eggs; natural honey; edible products of animal origin, not elsewhere specified or included’ (42 %, €19 billion). In imports of animal products, the largest chapter was ‘fish and crustaceans, molluscs and other aquatic invertebrates’ (71 %, €25 billion).
There are nine chapters in the vegetable products category. In exports of vegetable products, the largest chapter was ‘cereals’ (28 %, €13 billion). In imports of vegetable products, the largest chapter was ‘edible fruit and nuts; peel of citrus fruits or melons’ (29 %, €21 billion).
Fats and oils are a category on their own, imports were €15 billion and exports €10 billion.
Foodstuffs consist of various types of processed foods. The largest chapter in export of foodstuffs was ‘beverages, spirits and vinegar’ (30 %, €38 billion). In imports of foodstuffs, the largest chapter was ‘residues and waste from the food industries; prepared animal fodder’ (21 %, €13 billion)
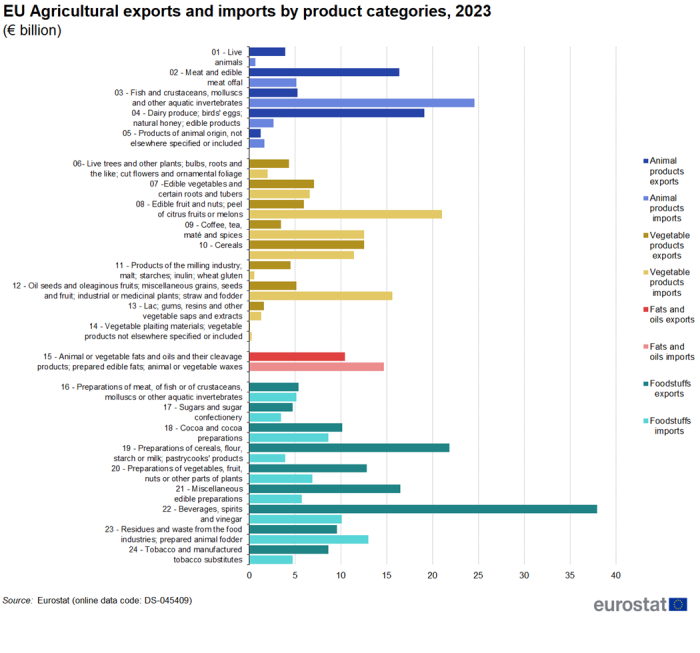 Figure 5: EU exports and imports of agricultural products by product category, 2023 (€ billion)
Source: Eurostat (ds-045409)
Agricultural products – developments between 2013 and 2023
In 2023, the value of total trade (imports plus exports) of animal products between the EU and the rest of the world was €81 billion (see Figure 6). Since exports (€46 billion) were higher than imports (€35 billion) there was a trade surplus of €11 billion. Between 2013 and 2023, EU trade in animal products increased by 50 %, equivalent to an average annual growth of 4.0 %. In this period, imports (4.1 %) increased more than exports (3.8 %).
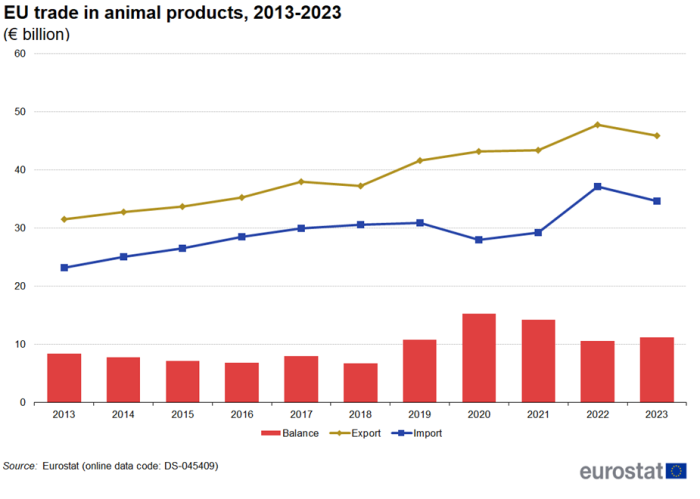 Figure 6: EU trade in animal products, 2013-2023 (€ billion)
Source: Eurostat (ds-045409)
In 2023, the value of total trade (imports plus exports) of vegetable products between the EU and the rest of the world was €116 billion (see Figure 7). Since exports (€45 billion) were lower than imports (€71 billion) there was trade deficit of €27 billion. Between 2013 and 2023, EU trade in vegetable increased by 60 %, equivalent to an average annual growth of 4.5 %. In this period, imports (5.3 %) increased more than exports (3.3 %).
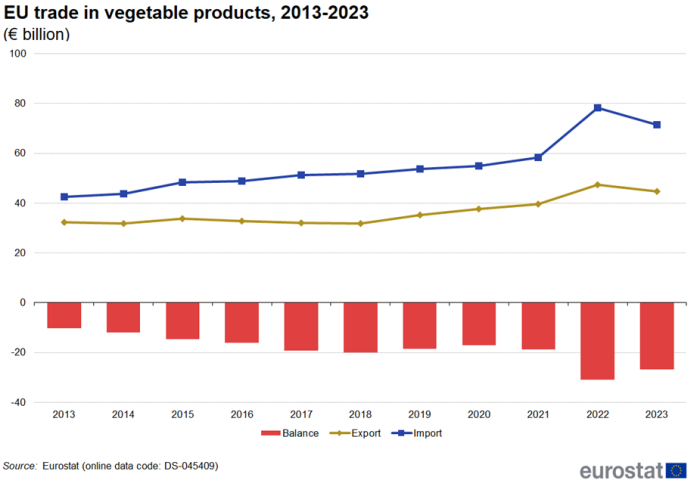 Figure 7: EU trade in vegetable products, 2013-2023 (€ billion)
Source: Eurostat (ds-045409)
In 2023, the value of total trade (imports plus exports) of fats and oils between the EU and the rest of the world was €25 billion (see Figure 8). Since exports (€10 billion) were lower than imports (€15 billion) there was trade deficit of €4 billion. Between 2013 and 2023, EU trade in vegetable products increased by 70 % equivalent to an average annual growth of 5.5 %. In this period, exports (5.8 %) increased more than imports (5.2 %).
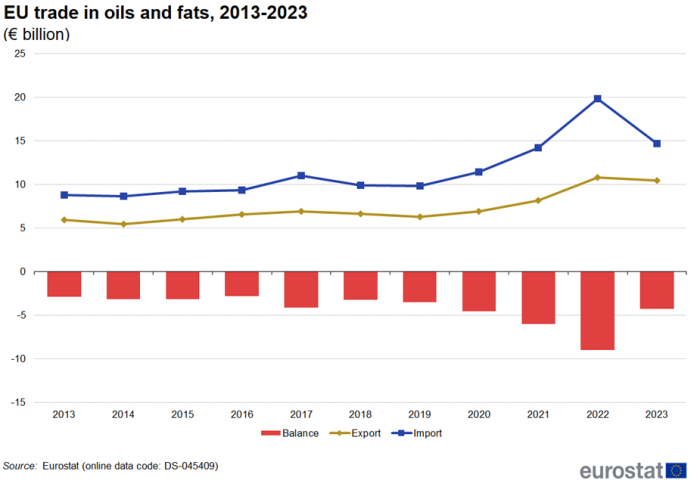 Figure 8: EU trade in fats and oils, 2013-2023 (€ billion)
Source: Eurostat (ds-045409)
In 2023, the value of total trade (imports plus exports) of foodstuffs between the EU and the rest of the world was €189 billion (see Figure 9). Since exports (€128 billion) were higher than imports (€62 billion) there was a trade surplus of €66 billion. Between 2013 and 2023, EU trade in foodstuffs increased by 60 %, equivalent to an average annual growth of 4.8 %. In this period, imports (5.4 %) increased more than imports (3.5 %).
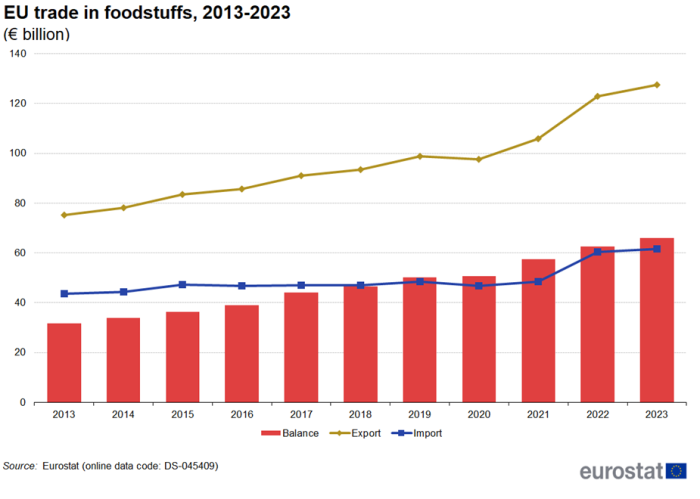 Figure 9: EU trade in foodstuffs, 2013-2023 (€ billion)
Source: Eurostat (ds-045409)
Main trading partners for agricultural products
In 2023, the United Kingdom was the EU’s largest export destination (€48.6 billion, 22 %) of agricultural products and the second largest origin of EU imports (€15.8 billion, 8 %), behind Brazil (€16.9 billion, 9 %) – see Figure 10.
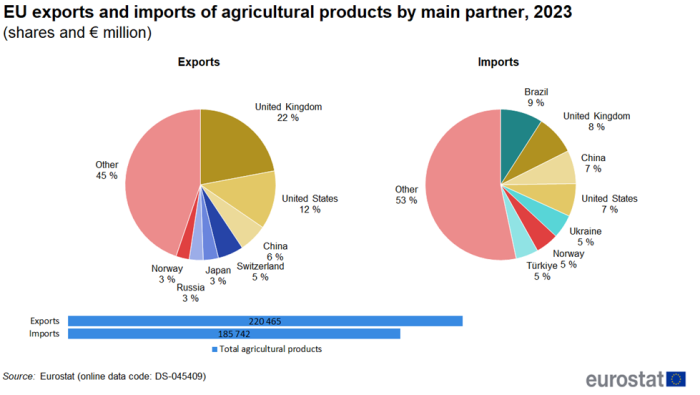 Figure 10: EU exports and imports of agricultural products by main partner, 2023 (shares and € million)
Source: Eurostat (ds-045409)
In 2023, the United Kingdom (€10.4 billion, 23 %) was the EU’s largest export destinations for animal products, while Norway (€8.5 billion, 25 %) was the largest origin of EU imports, mainly due to imports of fish products (see Figure 11).
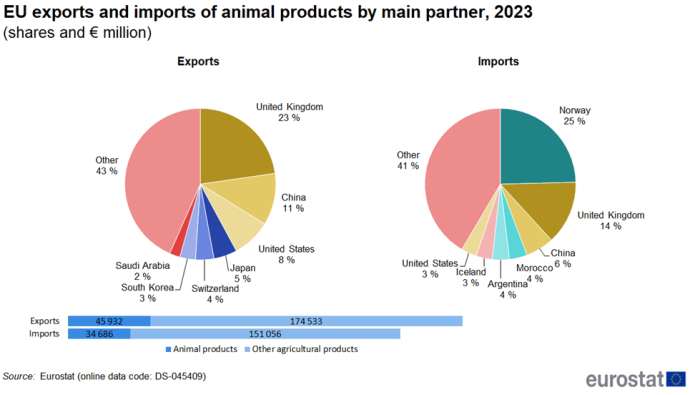 Figure 11: EU exports and imports of animal products by main partner, 2023 (shares and € million)
Source: Eurostat (ds-045409)
In 2023, the United Kingdom (€9.1 billion, 20 %) was the EU’s largest export destination for vegetable products, while Brazil (€8.1 billion, 11 %) was the largest origin of EU imports (see Figure 12).
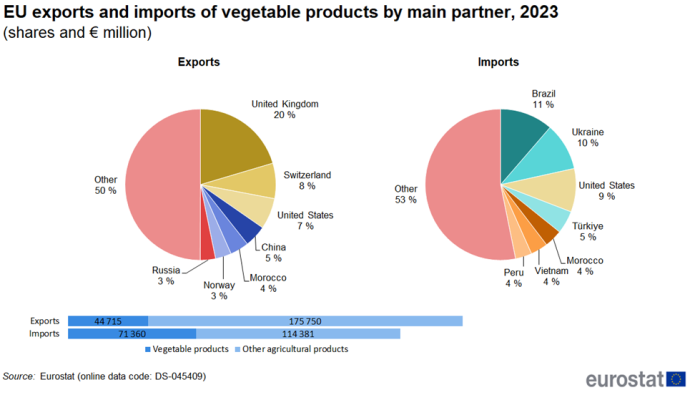 Figure 12: EU exports and imports of vegetable products by main partner, 2023 (shares and € million)
Source: Eurostat (ds-045409)
In 2023, the United States (€1.9 billion, 18 %) was the EU’s largest export destination for fats and oils, while Indonesia (€2.9 billion, 20 %) was the largest origin of EU imports (see Figure 13).
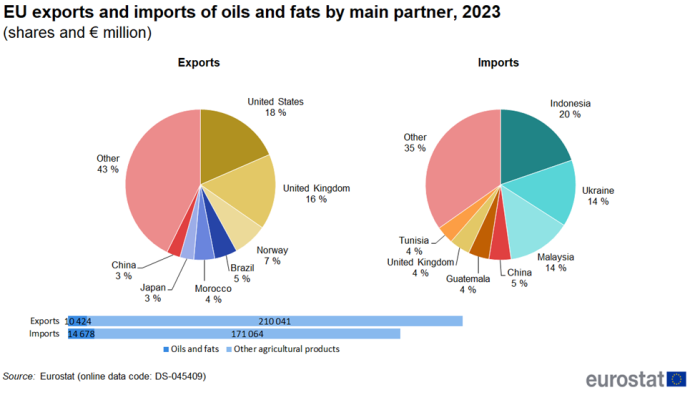 Figure 13: EU exports and imports of fats and oils by main partner, 2023 (shares and € million)
Source: Eurostat (ds-045409)
In 2023, the United Kingdom was both the EU’s largest export destination (€30.1 billion, 24 %) and the largest import origin (€9.6 billion, 16 %) of foodstuffs (see Figure 14).
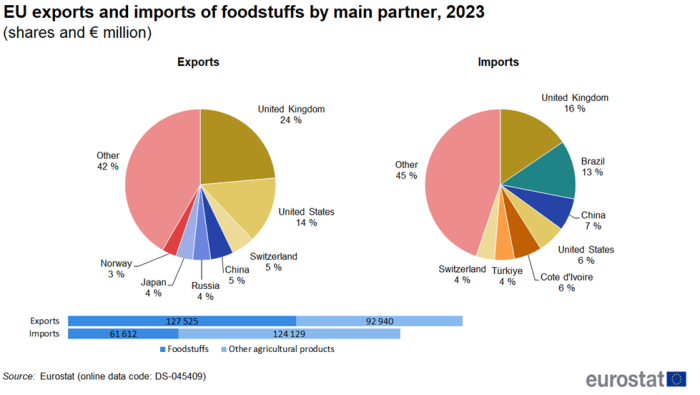 Figure 14: EU exports and imports of foodstuffs by main partner, 2023 (shares and € million)
Source: Eurostat (ds-045409)
Source data for tables and graphs
![]() Extra-EU trade in agricultural goods Excel file
Extra-EU trade in agricultural goods Excel file
Data sources
EU data comes from Eurostat’s COMEXT database. COMEXT is the Eurostat reference database for international trade in goods. It provides access not only to both recent and historical data from the EU Member States but also to statistics of a significant number of non-EU countries. International trade aggregated and detailed statistics disseminated from Eurostat website are compiled from COMEXT data according to a monthly process. Because COMEXT is updated on a daily basis, data published on the website may differ from data stored in COMEXT in case of recent revisions.
In this article, agricultural products are classified according to the sub-headings of the Combined Nomenclature (CN), based on the international classification known as the Harmonised commodity description and coding system (HS) administered by the World Customs Organisation. The 24 chapters (2-digit codes) of agricultural products in the CN nomenclature are grouped into 3 major types: animal, vegetable and foodstuff products. Chapter 15 (animal or vegetable fats and oils and their cleavage products; prepared edible fats; animal or vegetable waxes) is included in vegetables.
EU data are compiled according to community guidelines and may, therefore, differ from national data published by Member States. Statistics on extra-EU trade are calculated as the sum of trade of each of the 27 EU Member States with countries outside the EU. In other words, the EU is considered as a single trading entity and trade flows are measured into and out of the area, but not within it.
As of January 2021 onwards, data on trade with the United Kingdom is based on a mixed concept. In application of the Withdrawal Agreement Protocol on Ireland / Northern Ireland, for trade with Northern Ireland the statistical concepts applicable are the same as those for trade between Member States while for trade with the United Kingdom (excluding Northern Ireland) the same statistical concepts are applicable as for trade with any other extra-EU partner country. For these reasons, data on trade with the United Kingdom are not fully comparable with data on trade with other extra-EU trade partners, and for reference periods before and after the end of 2020.
Classifications
In international trade statistics, several classifications are used. Apart from the harmonised commodity description and coding system (HS), managed by the World Customs Organisation, data on trade is also available in the United Nations’ Standard International Trade Classification (SITC revision 4) and in the Broad Economic Categories (BEC) classification, the latter using end–use categories more adapted to economic analysis.
Unit of measure
Trade values are expressed in millions (106) or in billions (109) of euros. They correspond to the statistical value, i.e. to the amount which would be invoiced in case of sale or purchase at the national border of the reporting country. It is called a FOB value (free on board) for exports and a CIF value (cost, insurance, freight) for imports.
Context
The EU is the largest partner in international trade of agricultural products. While the EU imports mostly simple unprocessed agricultural goods, exports from the European Union are principally processed food products.
Data on international trade in agriculture products is used for two of the common EU policies: the Common Agricultural Policy (CAP) and the common trade policy which manages trade relations with non-EU countries. These are major policy areas of the European Union on which decisions are taken at Community level.
Statistics on international trade in agricultural commodities are fundamental in the evaluation and understanding of problems related to several political agendas, such as trade negotiations, food security, cooperation and aid towards developing countries and global sustainability.
Source link : https://ec.europa.eu/eurostat/statistics-explained/index.php/Extra-EU_trade_in_agricultural_goods
Author :
Publish date : 2024-05-08 07:00:00
Copyright for syndicated content belongs to the linked Source.
